Search
- 메인으로
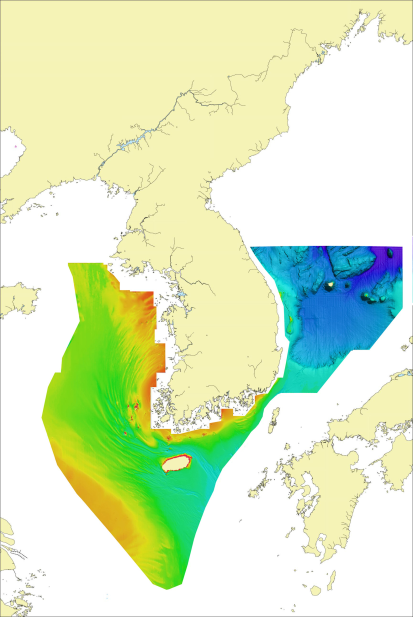
Bathymetric chart
This chart shows the elevations and shapes of marine features as contour lines, with the use of the multi-beam echo sounder measuring water depths of the ocean floor. The bathymetric chart depicts accurate shapes of the sea bottom the same as real ones, so it can be used in support for sea traffic safety as well as marine landform research and education.
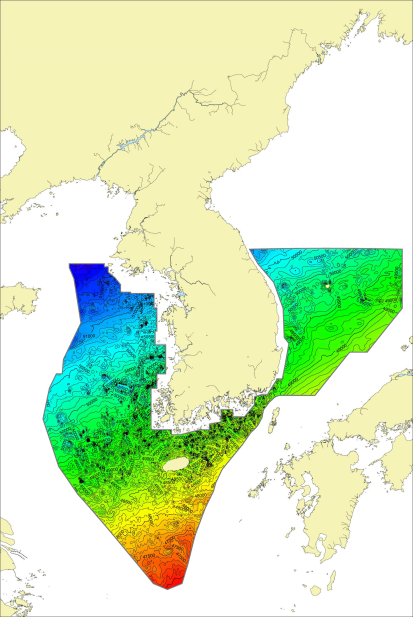
Free-air gravity anomaly chart
This chart shows contour lines on a map connecting points of equal gravity values corrected from the marine gravity measured with the marine gravity meter. The gravity anomaly is divided into the free-air anomaly and the bouguer anomaly according to data correction steps. Basic maps of the sea are free-air gravity anomaly based charts. The value of gravity depends on the density distribution of the inside of the ocean floor, so that the analyzed gravity can be used in geological structure research and submarine resource exploration.
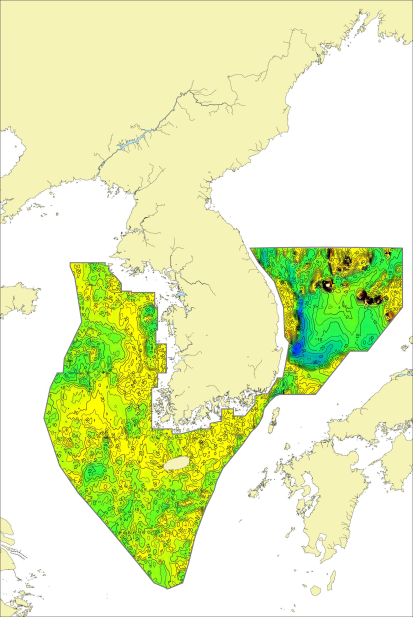
Total magnetic intensity chart
This chart is made up of isodynamic lines showing the geomagnetic flux density distribution of the sea floor, based on the analysis of magnetic components measured with the marine magnetometer. The geomagnetic field is the secondary magnetic field formed by rocks magnetized by the earth's magnetic field, and the intensity depends on types of rocks. Therefore, the relative strength of the geomagnetic intensity can be compared for use in understanding the features of submarine elements, studying geological structures, and exploring submarine resources.
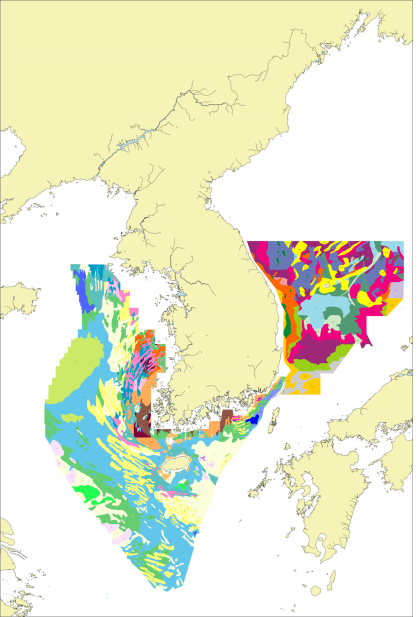
Sub-bottom echo character chart
This chart shows shapes and structures of marine surface sediments according to the range of their distribution, based on cross-sectional views of submarine strata surveyed with the seismic profiler and the samples of marine surface sediments collected with the sediment trap. As a valuable material in indirectly interpreting the sedimentary processes of the top layer of sediments with a height of 100 meters or below, the sub-bottom echo character chart can be used for geological structure research and submarine resource exploration.
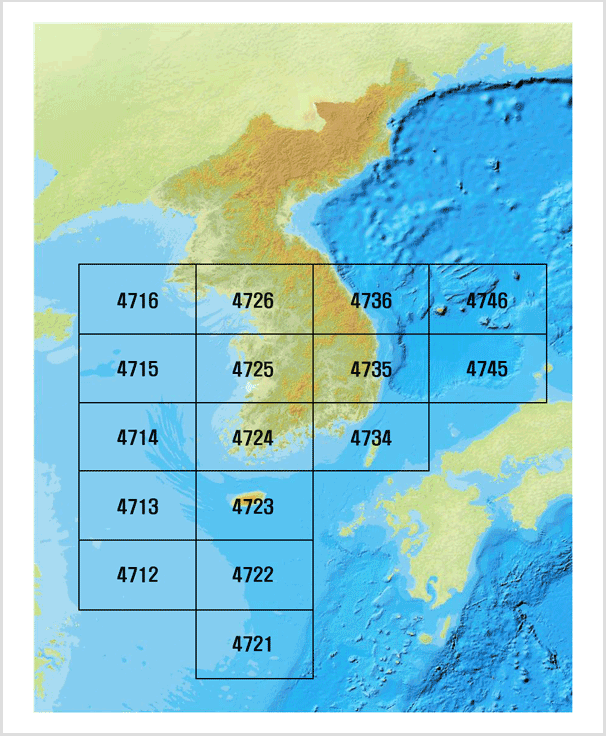
Scale of 1:250,000
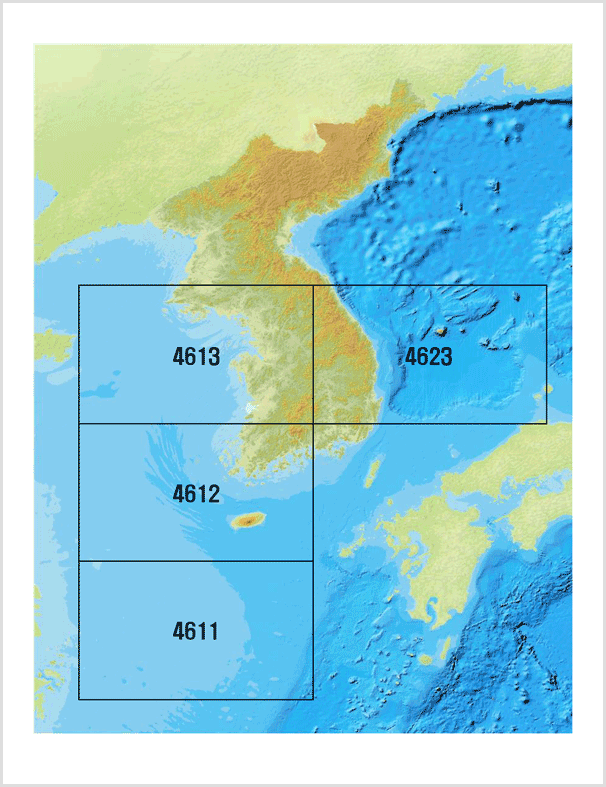
Scale of 1:500,000
E-mailinfokhoa@korea.kr
Address351, Haeyang-ro, Yeongdo-gu, Busan, Republic of Korea
COPYRIGHT(C) 2020 BY KOREA HYDROGRAPHIC AND OCEANOGRAPHIC AGENCY. ALL RIGHTS RESERVED.